

Article | Mar 07, 2021
Coffe for everybody
With 131 cups a year, a Peruvian drinks more coffee than a global consumer. E-commerce represents an opportunity to boost coffee sales.
.jpg)
Latin America is drinking more coffee. The annual growth rate for the period 2017 - 2022 varies between 2% and 4% for neighboring countries: Ecuador, Colombia, Brazil, Chile, Argentina and Uruguay. While for Peru, Bolivia and Paraguay; this fluctuates between 4% and 6%.
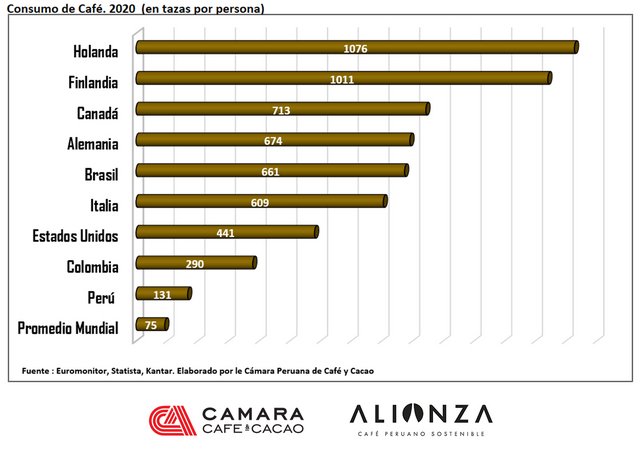
Peruvians consume 131 cups of coffee per year (Euromonitor 2020). It is still consumed less than in Brazil (661) or Colombia (290), but this number exceeds the global average per capita consumption, which is equivalent to 75 cups. According to Statista (2020), these values are distant from consolidated markets such as Europe and North America. However, the projection for the following years indicates a significant growth in consumption in the producing countries: by 2025, Peru will have increased by at least 34 cups, with 26% more consumption per person in 2020.
Much of the volume of coffee for domestic consumption sold in the country is sold in person through small grocery retailers, mainly in family businesses such as wineries or bakeries. In the last five years, this volume has increased by 30%, evidencing the preponderance of this traditional channel, whose logistics guarantee accessibility to consumers, providing exposure and proximity to the product. However, due to its dynamics and scale, this channel prioritizes and limits the diversity of formats that Peru can offer to a coffee consumer.
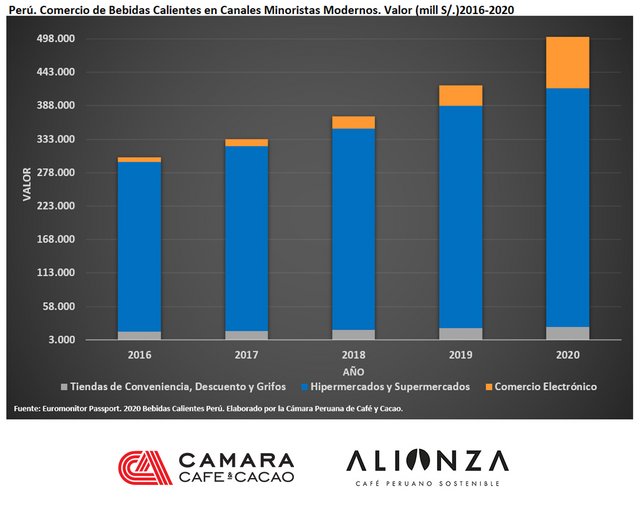
On the other hand, since 2016, e-commerce is within modern retail channels alongside convenience stores and supermarkets. According to Euromonitor (2020), this channel has had a growing interest in the hot drinks market - a category that includes coffee, tea and others - since in just four years the value of electronically marketed sales increased from 8 million to 84 million of suns. It is an attractive alternative for coffee consumers looking for variety on the offer of traditional channels.
In the following weeks and months we will share information on the coffee market in Peru, using different sources, we will analyze the points of sale, the homes and the trends projected by the industry; With these inputs and the contribution of the sector, we will work on the National Plan for the Promotion of Coffee Consumption, promoting the consumption of Peruvian coffee in different households and aligning this process with market trends.
The National Plan for the Promotion of Coffee Consumption is part of the Alliance for Sustainable and Competitive Coffee Project, executed by the Peruvian Chamber of Coffee and Cacao and the National Coffee Board as part of the SeCompetitive Program of the SECO Swiss Cooperation, in collaboration with Helvetas Peru and the Swiss Embassy in Peru.
SeCompetitivo Program Facebook: https://www.facebook.com/SeCompetitivo/
Facebook of the Peruvian Chamber of Coffee and Cacao: https://www.facebook.com/camcafeperu
___________________________________________________________________________
Bibliography
1) Euro monitor International. Cited in ABIC. 2019. Jornaldo Do Brasil. pp. 29.Available at https://www.abic.com.br/wp-content/uploads/2018/04/jc204_.pdf
2) ABIC. 2019. Jornaldo Do Brasil. pp. 34. Available at https://www.abic.com.br/wp-content/uploads/2018/04/jc204_.pdf
3) Kantar. Quoted in Infobae. (14.10.2020). Fedecafé, Colombia consumes more coffee in times of pandemic. https://www.infobae.com/america/colombia/2020/10/15/segun-fedecafe-colombia-consume-mas-cafe-en-tiempos-de-pandemia/. Consumption per household is 1160 cups, 4 consumers per household are assumed.
4) Armstrong, A. 2020. The countries most addicted to coffee. Statista Coffee Market Outlook. https://www.statista.com/chart/8602/top-coffee-drinking-nations/
5) Definition of small grocery retailers in the Euromonitor 2020 database. Hot Drinks. Peru
Labels within the retail channels studied in the Food and Beverage Expenditure Section. INEI.2020-third quarter. ENAHO.